Quick Summary
GPU Monitoring is no longer optional for developers working with machine learning, computer vision, or large language models. It is the difference between catching a memory leak before an overnight training run fails and discovering it only after hours of wasted compute. This guide walks developers through the tools, metrics, and dashboard patterns needed to build a dependable GPU Monitoring workflow in 2026, from a single local GPU to a fleet running on a Dedicated NVIDIA GPU Server. Whether you’re debugging a training script on a laptop or running a multi-GPU inference cluster in production, this guide covers what to track, which tools to use, and how to turn raw telemetry into decisions that save time and money.
Every developer working with GPUs eventually runs into the same problem: something is slow, or expensive, or both, and there’s no clear way to tell why. GPU Monitoring exists to close that gap. It gives you continuous visibility into utilization, memory, temperature, and power draw, so a stalled training run or a creeping inference latency shows up in your dashboards long before it shows up as an angry Slack message or a surprise cloud bill.
For most developers, the instinct is to treat GPU health as an operations concern, something the infra team handles after something breaks. But GPU Monitoring is just as much a developer tool as a logging framework or a profiler. A quick utilization check can tell you in seconds whether a “slow” training job is actually GPU-bound, or whether your data loader is the real bottleneck, a distinction that’s nearly impossible to spot from application logs alone.
This guide is built around that developer-first lens. It starts with lightweight, local GPU Monitoring you can set up in minutes, then works up to the production-grade stacks, DCGM Exporter, Prometheus, Grafana, that teams need once workloads move to shared clusters or dedicated infrastructure. By the end, you’ll have a clear roadmap for building monitoring into your workflow at whatever scale you’re operating at, from one workstation GPU to a fleet of GPU Servers for AI.
1. Why GPU Monitoring Matters for Developers
GPU Monitoring is the practice of continuously observing GPU health, utilization, memory, temperature, and power draw so developers can catch performance problems before they become outages. For developers, this is not an operations afterthought. It directly shapes how fast models train, how reliably inference APIs respond, and how much a GPU bill grows by month end.
There are three practical reasons developers cannot skip GPU Monitoring in 2026:
- Cost control: idle or underused GPUs are a major source of wasted cloud and hosting spend, and monitoring is the only reliable way to catch this early
- Debugging: a training job that silently slows down, or an inference endpoint whose latency creeps up, is almost always visible first in monitoring metrics before it shows up in application logs
- Reliability: proper monitoring catches thermal throttling, ECC memory errors, and driver instability before they cause a crash in a production pipeline
Recent research on GPU Monitoring tooling confirms that developer workflows increasingly combine lightweight command-line utilities with full observability stacks, since good visibility needs both fast local feedback while coding and long-term dashboards for production systems.
Do not wait until a training run fails to start GPU Monitoring. Add basic telemetry to your workflow from the first script you write, even if it is just a one-line utilization check running in a second terminal window.
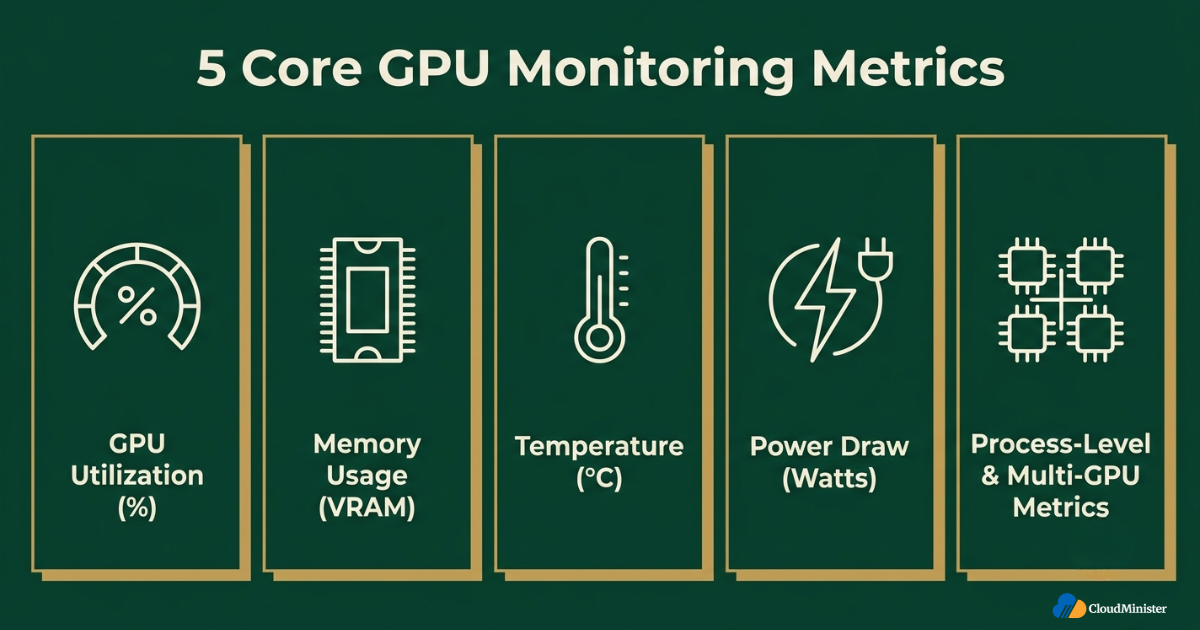
2. Core GPU Monitoring Metrics Every Developer Should Track
GPU Monitoring only becomes useful once you know which numbers actually matter. The metrics below form the foundation of any developer’s telemetry setup, whether you are running one card locally or coordinating dozens on infrastructure built as GPU Servers for AI.
2.1 GPU Utilization
- GPU utilization, shown as a percentage, is the single most checked metric on any monitoring dashboard, since it shows how much of the GPU’s compute capacity is actually being used
- Sustained low utilization during a training run usually means your data loader is the bottleneck, not the GPU itself, which is a very common finding once proper monitoring is in place
- Sampling should happen at short intervals, since a one-second average can hide brief spikes and stalls that a sixty-second average would smooth over
2.2 Memory Usage and Memory Bandwidth
- VRAM usage tells you how close a job is to an out-of-memory crash, and it is one of the most actionable numbers for developers debugging batch size issues
- Memory bandwidth utilization, separate from raw VRAM usage, shows whether a workload is compute-bound or memory-bound, which changes how you should optimize the code
- A monitoring dashboard that only shows total memory used and not memory bandwidth is missing half the picture for performance debugging
2.3 Temperature and Thermal Throttling
- GPU temperature above roughly 85 degrees Celsius is a commonly used threshold for flagging thermal throttling risk in a monitoring setup
- Thermal throttling silently reduces clock speed to protect the hardware, so a job can slow down for hours before a developer without proper visibility notices anything is wrong
- Fan speed and cooling telemetry belong in the same monitoring view as temperature, since the two numbers explain each other
2.4 Power Draw
- Power draw, measured in watts, is central to modern infrastructure telemetry because power costs and power limits now shape how workloads are scheduled
- Tracking power draw alongside utilization lets developers calculate work done per watt, an efficiency metric that is becoming standard practice in 2026
- Monitoring that ignores power draw cannot explain why two jobs with identical utilization numbers have very different electricity costs
2.5 Process-Level and Multi-GPU Metrics
- Process-level visibility shows exactly which script or container is consuming a given GPU, which matters the moment more than one developer shares a machine
- ECC error counts are a metric developers frequently overlook, but rising ECC error rates are an early warning sign of failing hardware
- On multi-GPU systems, dashboards need to show per-card metrics individually, since one straggling GPU in a distributed training job can bottleneck the entire run
A monitoring setup that only reports an average utilization number across a multi-GPU job hides the exact problem you need to see. Always break metrics down per device before averaging anything.
3. Command-Line GPU Monitoring Tools for Local Development
Before reaching for a full observability stack, most developers start GPU Monitoring with command-line tools they can run directly on a workstation or a remote server over SSH.
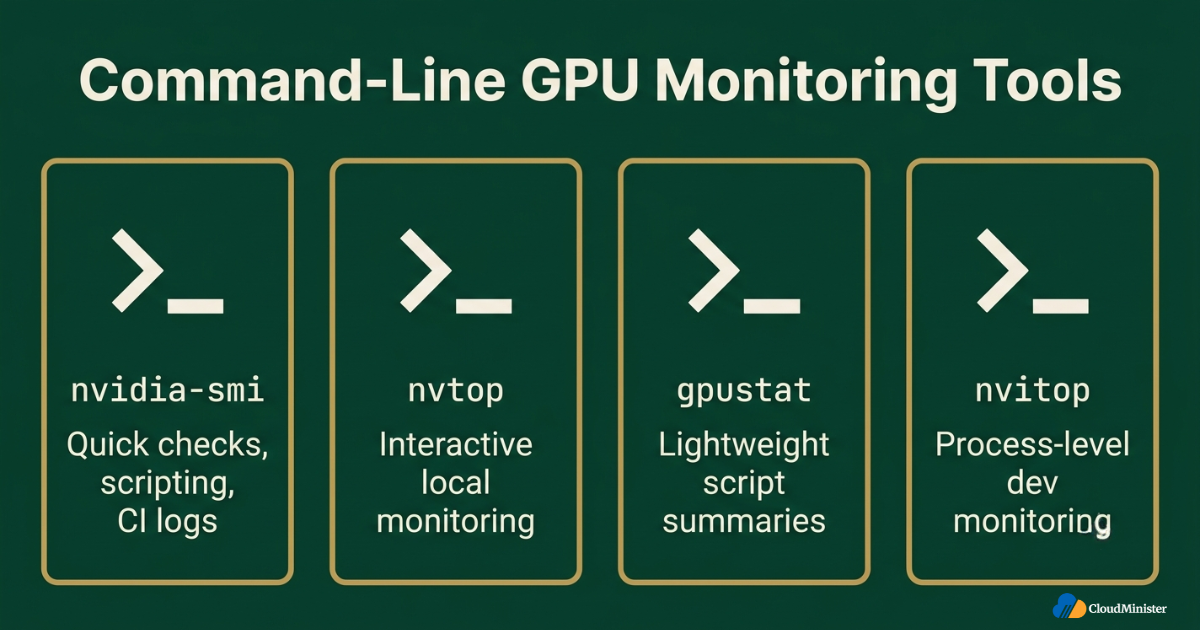
- nvidia-smi: the foundational monitoring utility shipped with NVIDIA drivers, useful for a quick snapshot of utilization, memory, temperature, and power draw
- Running nvidia-smi with a loop interval (once per second) turns a static snapshot into live visibility during an active training or inference session
- nvtop: an interactive, terminal-based tool that behaves like a process manager for the GPU, showing per-process utilization and memory in real time
- gpustat: a lightweight wrapper around nvidia-smi, outputting a compact, easy-to-read summary popular for quick checks inside scripts and CI logs
- nvitop: a more feature-rich tool with an interactive dashboard, historical graphs, and process-level breakdowns designed specifically for machine learning workflows
A detailed comparison of GPU Monitoring tooling published in early 2026 highlighted nvitop and nvidia-smi as the two most widely used starting points, with nvitop favoured for interactive, process-level visibility during active development and nvidia-smi remaining the reliable default for scripting and automation.
Alias a one-second nvidia-smi loop to a short command in your shell profile. Fast, frictionless GPU Monitoring during development catches far more problems than a dashboard you only open once a week.
4. Building a Production GPU Monitoring Stack
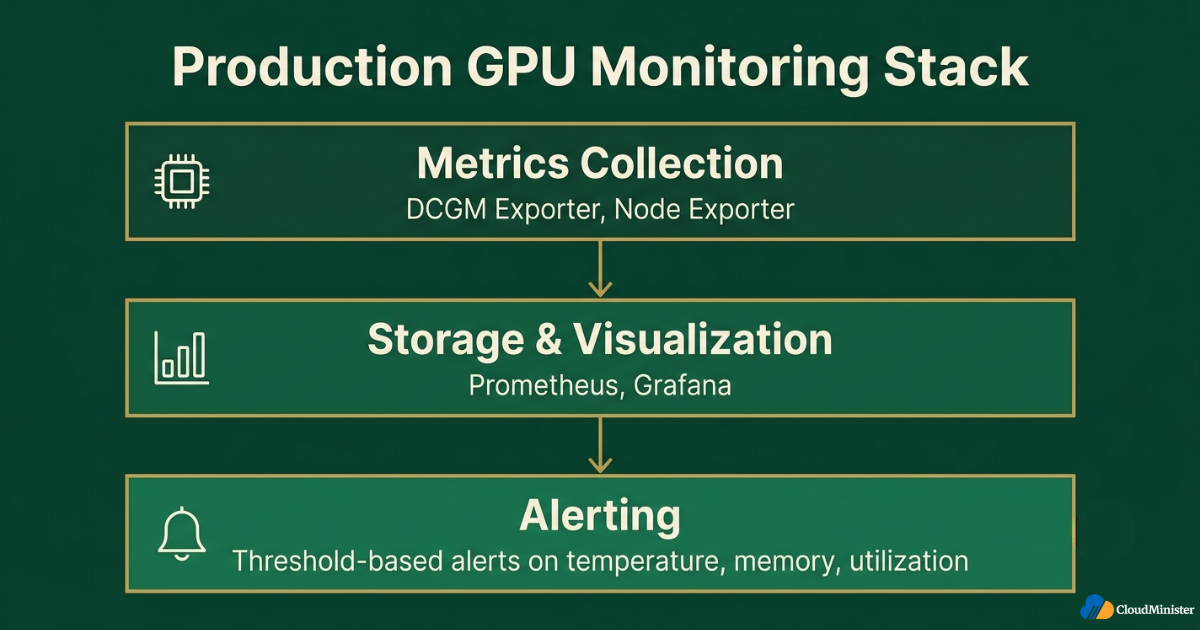
Command-line tools are excellent for local debugging, but production systems need GPU Monitoring that persists data, triggers alerts, and gives the whole team a shared view. This is where a proper observability stack comes in.
4.1 Metrics Collection Layer
- DCGM Exporter (Data Center GPU Manager) is the standard way to expose detailed GPU telemetry in a format that observability platforms can scrape
- Node exporter combined with a GPU-specific exporter gives combined visibility into both the host machine and the GPU hardware in one place
- Cloud-native integrations, such as pushing GPU metrics into a managed monitoring namespace, are useful when workloads run partly on managed cloud infrastructure alongside dedicated GPU Servers for AI
4.2 Storage and Visualization Layer
- Prometheus is the most common time-series database used to store GPU telemetry scraped from DCGM Exporter or similar agents
- Grafana dashboards turn raw telemetry into charts the whole engineering team can read at a glance, including per-GPU utilization, memory, temperature, and power panels
- For larger fleets, a scalable metrics backend is sometimes layered in front of Grafana to keep long-term telemetry queries fast as data volume grows
4.3 Alerting Layer
- Alerts should be tied to thresholds that matter operationally: sustained low utilization, memory near capacity, temperature above the throttling point, and rising ECC error counts
- Alert fatigue is a real risk, so alerts should be tuned to fire on sustained conditions, not single noisy data points
- Queue depth and job-wait-time alerts, layered on top of raw metrics, help catch scheduling bottlenecks before developers notice slow turnaround on their jobs
Monitoring dashboards often expose process names, container labels, and sometimes file paths tied to a specific project. Restrict dashboard access with role-based permissions, especially on shared infrastructure, so this visibility does not become an information leak between teams.
5. GPU Monitoring for Different Developer Workflows
5.1 Training Workloads
- During training, monitoring should focus on utilization consistency, since dips usually point to a slow data pipeline rather than the model itself
- Memory usage trends over the course of a training run are a key signal for catching memory leaks before they crash a multi-day job
- For large training jobs running on infrastructure built as ai training servers, per-GPU visibility across the whole cluster is essential to catch a single underperforming card dragging down distributed training
- Teams operating ai training servers around the clock should treat monitoring history as part of routine maintenance, not just incident response
- Checkpoint frequency on ai training servers is often tuned based on monitoring data showing how often a run is interrupted by transient slowdowns
Multi-tenant ai training servers, where several developers share the same cluster, benefit the most from process-level GPU Monitoring, since it is the only way to attribute a slowdown to a specific job rather than the whole fleet of ai training servers. Well-run ai training servers publish monitoring dashboards internally so every engineer can see current load before scheduling a new job, which reduces contention on shared ai training servers considerably.
5.2 Inference Workloads
- Inference-focused monitoring should prioritize latency-correlated metrics, since a slow response often traces back to a GPU that is memory-constrained or thermally throttled
- Batch size and concurrent request tracking, layered alongside standard metrics, help developers right-size autoscaling rules for inference endpoints
- Cost-per-request calculations become far more accurate once telemetry on power draw and utilization is available for every inference GPU in the fleet
5.3 CI/CD and Automated Testing Pipelines
- Lightweight monitoring inside CI pipelines catches GPU-related test failures caused by memory contention between parallel test jobs
- Logging basic monitoring output alongside test results makes flaky GPU-dependent tests far easier to diagnose after the fact
Related Reading: Dedicated NVIDIA GPU Server infrastructure for AI training in 2026 .
5.4 Special Considerations for Shared ai training servers
- Scheduling conflicts on shared ai training servers are usually diagnosed faster with proper telemetry than by asking teammates what they are currently running
- Capacity planning for ai training servers should lean on several weeks of monitoring history rather than a single busy day
- Documenting monitoring conventions across all ai training servers in an organization keeps dashboards consistent as new hardware is added
- When onboarding a new developer to shared ai training servers, walking them through the monitoring dashboard on day one prevents accidental resource hogging
- Cost allocation across departments sharing the same ai training servers depends entirely on accurate, process-level monitoring data
Organizations running multiple clusters of ai training servers across regions often centralize monitoring into a single pane of glass, since comparing metrics across separate clusters manually does not scale past a handful of machines. As the fleet grows, the investment in a proper monitoring stack pays for itself almost immediately in reduced troubleshooting time.
Ready to Monitor GPU Performance at Scale?
Get full hardware-level telemetry access with a Dedicated NVIDIA GPU Server built for demanding training and inference workloads.
6. GPU Monitoring in Cloud and Hosted Environments
GPU Monitoring looks slightly different depending on whether your workload runs on a personal workstation, a shared cloud GPU instance, or a Dedicated NVIDIA GPU Server. Developers should adjust their approach based on how much control they have over the underlying hardware.
- On shared cloud instances, visibility is limited to what the provider exposes through their own dashboard or API, which can hide noisy-neighbour contention affecting your workload
- On a Dedicated NVIDIA GPU Server, developers get full visibility into hardware-level telemetry, since there are no other tenants competing for the same card
When comparing best GPU cloud hosting in India options, developers should specifically ask whether the provider exposes raw GPU Monitoring metrics through an API, or only a summarized dashboard.
- Teams evaluating best GPU cloud hosting should treat monitoring access as a checklist item, since some providers restrict telemetry access on lower-tier plans
- Reviews of best GPU cloud hosting vendors rarely mention monitoring API access directly, so developers usually have to ask support teams or read the fine print of the service level agreement
- A plan advertised as best GPU cloud hosting on price alone can still fall short if it does not expose per-second telemetry that a developer actually needs during debugging
Developers who have used both dedicated and pay-per-use tiers of best GPU cloud hosting generally agree that monitoring granularity, not raw price, is what separates a good developer experience from a frustrating one. The best GPU cloud hosting plans for engineering teams are the ones that treat telemetry access as a default feature rather than an add-on.
If you are still comparing providers, our breakdown of GPU cloud providers in India is a useful companion resource, since monitoring capability varies significantly between vendors and is worth weighing alongside price.
Before signing a hosting contract, ask the provider directly what telemetry their API exposes and at what sampling interval. A provider offering only hourly averages makes real-time debugging effectively impossible.
A note on vendor selection: developers comparing best GPU cloud hosting options for the first time often assume every provider exposes the same level of telemetry. In practice, best GPU cloud hosting plans differ enormously in this regard. Some best GPU cloud hosting vendors give full API access to raw metrics, while others summarize everything into a single opaque usage percentage. Reading the documentation for best GPU cloud hosting plans before committing saves considerable frustration later, since switching best GPU cloud hosting providers mid-project is disruptive. For teams unsure where to start, shortlisting three or four best GPU cloud hosting candidates and testing their monitoring APIs directly is more reliable than trusting marketing pages alone. The gap between the best GPU cloud hosting reviews online and the actual developer experience of best GPU cloud hosting in daily use can be significant, so hands-on testing remains the safest approach.
7. GPU Monitoring Tool Comparison Table
| GPU Monitoring Tool | Best For | Interface |
| nvidia-smi | Quick checks, scripting, CI logs | Command line |
| nvtop | Interactive local GPU Monitoring | Terminal UI |
| gpustat | Lightweight summaries in scripts | Command line |
| nvitop | Process-level GPU Monitoring during development | Terminal UI |
| DCGM Exporter | Feeding production GPU Monitoring pipelines | Metrics exporter |
| Prometheus + Grafana | Team-wide GPU Monitoring dashboards and alerts | Web dashboard |
A number of the mistakes below are more common on shared cloud instances than on a Dedicated NVIDIA GPU Server, since dedicated hardware removes the guesswork about whether a slowdown is caused by your own workload or somebody else’s. Documentation quality is often the fastest signal of which best GPU cloud hosting provider takes developer experience seriously, and monitoring API docs are a good place to check first
8. Common GPU Monitoring Mistakes Developers Make
- Relying only on average utilization: a job can average 60 percent utilization while actually alternating between 100 percent and 0 percent, and monitoring that only reports averages hides this pattern completely
- Ignoring memory bandwidth: many developers set up monitoring for VRAM capacity but skip bandwidth, missing a whole category of memory-bound performance problems
- No historical retention: monitoring that only shows live data cannot answer the question of when a slowdown actually started, which matters for root-cause analysis
- Treating GPU Monitoring as ops-only: developers who never look at these dashboards themselves miss the fastest feedback loop available for optimizing their own code
- Skipping power metrics: monitoring without power draw data cannot support the cost-per-job calculations that justify infrastructure decisions to a budget owner
In short, price alone is a poor proxy for quality when shortlisting best GPU cloud hosting options, and monitoring transparency is a much better signal of a provider worth trusting long term.
9. Setting Up GPU Monitoring: A Step-by-Step Developer Roadmap
Phase 1: Local GPU Monitoring (Day 1)
- Install nvidia-smi (bundled with GPU drivers) and confirm it reports utilization, memory, temperature, and power correctly
- Add nvitop or gpustat for a more readable interactive monitoring view during development
- Set a personal habit of checking utilization output before assuming a slow script is a code problem rather than a hardware bottleneck
Phase 2: Scripted GPU Monitoring (Week 1)
- Add a background logging loop that records monitoring metrics to a file during long training runs
- Correlate telemetry logs with your training loss curve to catch performance regressions that coincide with configuration changes
Phase 3: Team-Wide GPU Monitoring (Week 2-3)
- Deploy DCGM Exporter alongside Prometheus so monitoring data is centrally stored, not just visible on individual machines
- Build a shared Grafana dashboard so every developer on the team has the same view during code review and incident response
- Document monitoring thresholds as a team standard, so everyone agrees on what counts as a temperature or utilization problem worth investigating
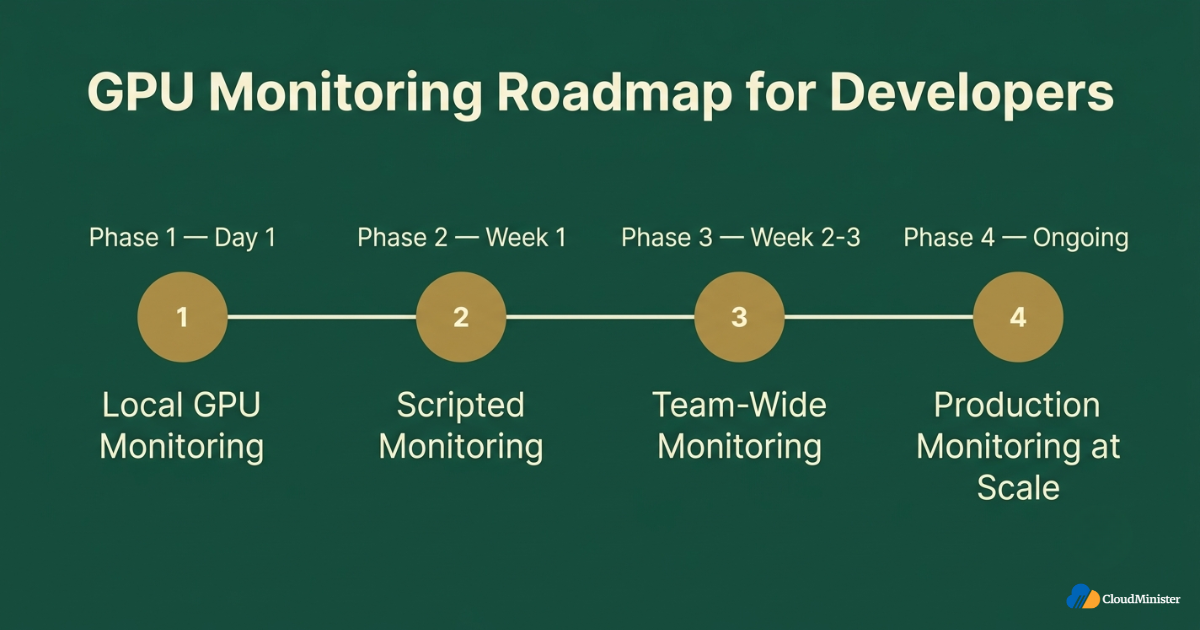
Phase 4: Production GPU Monitoring at Scale (Ongoing)
- Set alerting rules on top of monitoring metrics for temperature, memory pressure, and sustained idle time
- Review telemetry weekly to catch slow-moving trends like gradually rising temperatures from dust buildup or aging thermal paste
- Revisit monitoring dashboards after every infrastructure change, since a new driver version or container image can silently shift baseline metrics
Related Reading: GPU server rental versus buying TCO analysis for India,
10. GPU Monitoring and Infrastructure Decisions
Good GPU Monitoring does more than catch problems. Over weeks of data, it becomes the evidence base for infrastructure decisions that would otherwise be guesswork.
- Sustained high utilization visible in monitoring data is the clearest signal that a workload has outgrown a shared or entry-level plan and needs a Dedicated NVIDIA GPU Server
- Monitoring history showing memory ceilings being hit repeatedly is direct evidence for upgrading VRAM capacity rather than a subjective guess
Teams building on GPU Servers for AI should feed usage data directly into capacity planning, since concurrent workload counts rarely match initial estimates once real usage begins.
For Indian teams sourcing infrastructure, working with a Web Hosting Company in India that exposes granular GPU Monitoring telemetry makes this kind of data-driven scaling decision far easier than working with a provider that only shows a black-box usage summary.
Related Reading: how much VRAM you actually need
Treat six to eight weeks of monitoring history as the minimum evidence base before making a hardware upgrade decision. Shorter windows are too easily skewed by one unusually busy or unusually quiet sprint.
Whatever the deployment model, from a single workstation to a fleet of ai training servers spread across regions, the fundamentals of good monitoring stay the same: track utilization, memory, temperature, and power consistently, and store enough history to spot trends before they become incidents.
Teams weighing whether to build their own fleet of ai training servers or rent capacity should treat the monitoring data from this guide as the starting point for that comparison. Several months of solid telemetry from a smaller deployment reveals far more about whether dedicated ai training servers make financial sense than any vendor calculator, and it removes the guesswork from deciding when to invest in ai training servers versus continuing to rent capacity from a provider that manages ai training servers on your behalf. The five extra minutes it takes to review a monitoring dashboard before scaling a fleet of ai training servers is consistently worth it.
11. GPU Monitoring, Cost, and the Broader 2026 Infrastructure Context
GPU Monitoring decisions do not happen in isolation. They sit inside a much larger 2026 infrastructure story, where GPU capacity, power availability, and cost efficiency are under more scrutiny than ever before.
Enterprises running sustained GPU utilization above roughly 70 percent have been shown to reduce total cost of ownership by 40 to 60 percent compared with equivalent public cloud spend, which is exactly the kind of finding that only surfaces once consistent telemetry is available to analyze, according to a 2026 industry analysis of GPU data center economics.
At the hardware level, GPU power needs have roughly doubled in three years, moving from around 400 watts to over 1,000 watts per accelerator, which is why power draw has become such a central metric in any serious 2026 monitoring setup.
These trends reinforce the same conclusion from a developer’s chair as from an infrastructure budget owner’s chair: GPU Monitoring is not optional overhead. It is the mechanism that connects code-level performance to real infrastructure cost, and developers who build this visibility into their workflow early save both debugging time and hosting spend later.
Choosing the right Web Hosting Company in India for the orchestration and API layer around your GPU workloads is a separate decision from GPU hardware itself, but the two should be evaluated together for latency and support quality.
As a final note on infrastructure choice, teams that treat best GPU cloud hosting selection as a one-time decision often regret it. Revisiting best GPU cloud hosting options annually, as monitoring data reveals new patterns in usage and cost, keeps infrastructure spend aligned with actual need. The best GPU cloud hosting plan for a three-person team prototyping a model is rarely the best GPU cloud hosting plan for the same team a year later running production traffic. Letting monitoring data drive that best GPU cloud hosting conversation, rather than habit or inertia, is the more disciplined approach.
12. GPU Monitoring Checklist for Developers
- Command-line monitoring tool (nvidia-smi, nvitop, or gpustat) installed and tested locally
- Background monitoring logging enabled for any training run longer than a few minutes
- DCGM Exporter or equivalent deployed for team-wide monitoring visibility
- Prometheus and Grafana configured to store and visualize GPU Monitoring history, not just live data
- Alert thresholds documented and agreed on for temperature, memory, and utilization within your monitoring stack
- Per-GPU breakdown confirmed for any multi-GPU job, not just fleet-wide averages
- Power draw tracked alongside utilization so telemetry can support cost-per-job calculations
- Dashboard access restricted appropriately on shared infrastructure to avoid unnecessary information exposure
- Hosting provider confirmed to expose granular monitoring metrics through an API, not just a summarized dashboard
- Monitoring history reviewed periodically to catch slow-moving hardware degradation
Key Takeaways
- GPU Monitoring gives developers the earliest possible signal for performance problems, cost waste, and hardware issues, well before they show up as application-level failures
- Utilization, memory, temperature, power draw, and process-level metrics form the core set every monitoring setup should track
- Command-line tools like nvidia-smi, nvitop, and gpustat are the right starting point for local monitoring, while DCGM Exporter, Prometheus, and Grafana form the production-grade stack
- Monitoring needs differ across training, inference, and CI/CD workflows, and dashboards should be tuned to the metrics that matter for each
- Weeks of monitoring history is the strongest evidence base for deciding when to move from shared infrastructure to a Dedicated NVIDIA GPU Server or scale into GPU Servers for AI
- Power draw has become a first-class GPU Monitoring metric in 2026 as GPU power consumption per accelerator continues to climb
Need Help Setting Up Your GPU Monitoring Stack?
Talk to our team about building a monitoring workflow that fits your training, inference, or CI/CD pipelines.
Conclusion
GPU Monitoring is one of the highest-leverage habits a developer working with GPUs can build. It turns invisible bottlenecks into visible, fixable problems, and it turns infrastructure spending decisions from guesswork into evidence-backed choices. Starting simple with command-line tools and growing into a full observability stack as your workload scales is the most reliable path, and every phase of that journey pays for itself many times over in saved debugging time and avoided wasted compute.
CloudMinister provides Dedicated NVIDIA GPU Server infrastructure, GPU Servers for AI, and hosting built for Indian developers who need real GPU Monitoring visibility into every workload they run.
Frequently Asked Questions
What is GPU Monitoring and why do developers need it?
It is the practice of tracking GPU utilization, memory, temperature, and power draw in real time so developers can catch performance problems and cost waste before they affect production systems.
Which GPU Monitoring tool should a developer start with?
Most developers start with nvidia-smi for a quick check, then move to nvitop or gpustat for an interactive, process-level view during active development.
How is GPU Monitoring different for training versus inference workloads?
Training-focused GPU Monitoring tracks utilization consistency and memory trends over long runs, while inference-focused monitoring prioritizes latency-correlated metrics and cost-per-request calculations.
Does GPU Monitoring matter on a Dedicated NVIDIA GPU Server?
Yes. A Dedicated NVIDIA GPU Server gives GPU Monitoring full access to hardware-level telemetry without noisy-neighbour interference, which makes metrics far more reliable than on a shared instance.
What is the biggest mistake developers make with GPU Monitoring?
The most common mistake is relying only on average utilization numbers, which can hide alternating spikes and stalls that a proper GPU Monitoring setup with short sampling intervals would reveal.

He is the CEO and Founder with over a decade of experience in cloud infrastructure, DevOps, and server optimization. With a strong vision and hands-on leadership approach, he has built scalable, secure, and high-performance cloud solutions trusted by businesses across industries.